Measuring User Value – ARPU & LTV
A user has many different facets that we as the product owner or analyst need to understand. In previous posts, we investigated some of these like retention; and this post is going to be on maybe the most important facet for financial success: the value of the users. To make things complicated, there are many different ways to define this “value”; and they don’t even have to involve money in some cases! However, for this post, I will focus on how to define and measure the monetary value of your users, and the two different but equally important methods to measure it: ARPU and LTV.
The definition of each is a good starting point:
Average revenue per user (ARPU): what is the average revenue from a group of users in a set time frame?
The lifetime value of a user (LTV): how much a typical user spends on the product from the start until they stop using the product.
Before breaking down the definitions of each, here is the pseudo formulas of the two metrics as well:
ARPU: (Total Revenue Generated) / (The number of people who generated it)
LTV: Total Revenue Generated by an individual user x, in their lifetime (usually ~1 year)
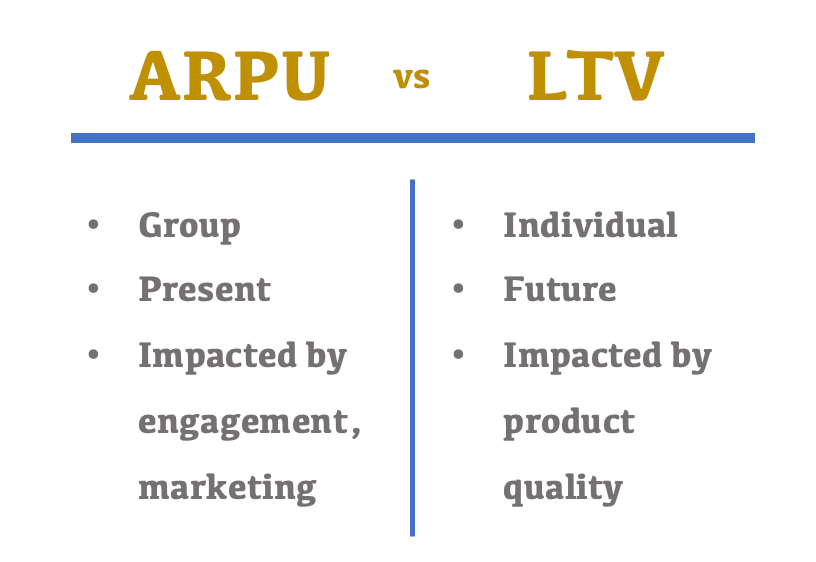
There are two key differences between these two. The first one is ARPU is a group metric**,** while LTV is an individual metric**.** A single user can not have an ARPU because that would just be his total revenue generated! A group can not have LTV either, as users in the group will not have the exact “life” in the product, will start and stop at different times and it is not easy to consolidate.
The second difference is ARPU is calculated on a set time frame, while LTV is a certain length of time with different start and stop points. An example is very useful to internalize this:
- ARPU is can be for December 2022, so Revenue in the month divided by the number of people active in December 2022.
- Say, a user typically uses the app for a year before they quit, and they spend £5 on it in this time. The LTV is £5, and we can expect someone who first opens an account today to generate this amount in a year, and likely have quit by then.
Pro Tip!
LTV is a direct representation of the quality of the product, while ARPU is dependent on other factors such as user acquisition and marketing.
Improving the product and increasing the lifetime of a user and the amount they spend directly improves LTV.
Bringing a lot of users to try the product with a big marketing budget may lower ARPU, or a seasonal sale may increase ARPU without having anything to do with the product.
These two metrics are both needed; there is no approximation between the two if we know one or the other. As a relief, they are not complicated to calculate and we will attempt to further break down the decision process behind these calculations.
The Right Time
As mentioned, the two metrics have diverse approaches to time. ARPU uses known, a.k.a. historical information, while LTV is predicting the future total that we will have a year from now. Here is an example of this difference, and how to use them the correct way:
You have a company that has been running for 5 years, so you got the metrics and calculations you need with enough users. One day, you notice from your dashboard that notice ARPU per day is going down, but the (predicted) LTV is stable. Thinking these from the definitions above:
- The revenue you generated per active user today is lower than yesterday.
- An individual user will still contribute the revenue they are expected to do, so it is not a product trend.
What might have happened? Maybe you have a great campaign today that brought in thousands of new users, and you know usually your users generally don’t wish to buy something until their 5th day in the game. Or maybe the in-game event has ended, and players are waiting for the next event to spend again?
The right time frame for calculating these metrics is important for them to be insightful. However, if you do manage to find the correct ones; ARPU can provide a great snapshot of the present, and LTV can steer you towards the right direction.
Now that we covered the time aspect difference, let’s go to the second relevant factor in the calculation: defining the audience.
The Right People
Remember from our initial breakdown of the definitions, that ARPU is a group metric while LTV is an individual metric. To put it in another way; while calculating ARPU, we need more than one person for it to be truly an average. The main factor in what ARPU tells you depends on whom you base this calculation on. Some examples include users who…
- …have come from a specific banner ad you designed
- …signed up 1 week ago, on Monday
- …were active within the last 30 days
After this, you just need to calculate the correct total revenue from those specific users. So the total revenue generated in the last 30 days is divided by the number of unique active users in the last 30 days.
The LTV, on the other hand, is for individual users. Let’s say for a user that joins today, you predict an LTV of $30. If you got 1000 users today, you can expect to have $30k within a year, but you will not know when this amount is going to come in. Maybe you will get $82/day for the rest of the year, or half of these 1000 users will pay upfront the entire amount tomorrow and you will receive $15k!
I feel another repeat should be good to internalize these differences, so here is another breakdown:
- Your daily ARPU is $X, meaning you are making X times your active users right now. If you expect nothing to change with your product, users, marketing, etc.. tomorrow, you can expect to make the same amount.
- Your lifetime is 1 week, and your LTV is 4$. If you get 1000 users today, you can expect to make $4k within a week.
The elephant in the Dashboard: Conversion Rate
The final difference I will discuss is how the conversion rate is factored into these metrics. Conversion rate is a very important metric; in fact, it is so important there will be further posts on it specifically. A brief description of the conversion rate is what % of your users you expect to pay for your product.
We can calculate the conversion rate with the same splits for user value – by time frame and the group of people. As we defined above, ARPU inherently calculates the conversion rate of a group, while LTV is an individual. We can have 20% of a group convert, but we can not have 20% of an individual paying.
The solution to this issue, is that in LTV, the conversion rate becomes a probability rather than a metric. We can say any given user is 20% likely to convert by day 7, so the conversion rate by day 7 is 20%.
To reiterate, the conversion rate is a very important concept that we can’t explain in just a section in another post – but the application of time and people we described for user value applies to the conversion rate.
Conclusion
For the final section, here is a summary, of the best use cases for each metric and what we may encounter in real-world applications.
ARPU is good for:
…understanding current trends and short-term factors affecting revenue
…dashboards to monitor revenue health
…compare with other historical metrics like activations, marketing spend
…measure realised revenues
LTV is good for:
…predicting long-term revenues
…identify the potential issues without a user experiencing them
…drive campaign performance decisions in a much shorter term
…report future and expected revenues
A few example cases, and how it would (likely) impact each metric:
- Improving first conversion experience
- ARPU would increase for the day/week after the implementation. Predicted LTV may increase if people decide to spend more
- Having an in-game event:
- ARPU would increase during the event. If you had done a similar event before, LTV would not change as much, but if it is a brand new event it might impact LTV (because you could not have considered it in your models)
- An acquisition campaign brought in a lot of new users
- ARPU on the days during the campaign likely will decrease. LTV does not change; but if the players are generating more value than our expectations for the campaign, we might wish to invest more into it!